A Guide to the GA4 Reporting Dashboard

In recent months the industry has seen more migrations than Planet Earth’s camera crew as everyone prepared for Universal Analytics’ sunset date, only to find that the rollout is being staggered and some properties are still reporting anyway. Whether or not you are lucky enough to not rely on GA4 yet, it’s time to get familiar with the new analytics dashboard.
Start with a bit of admin
The first thing that’s different is the admin screen. Where you had Views in Universal Analytics to apply different filters, this has now been replaced with a Data Stream.
Within data stream settings you’ll find your Measurement ID, the enhanced measurement events being tracked by default, and other tag settings.
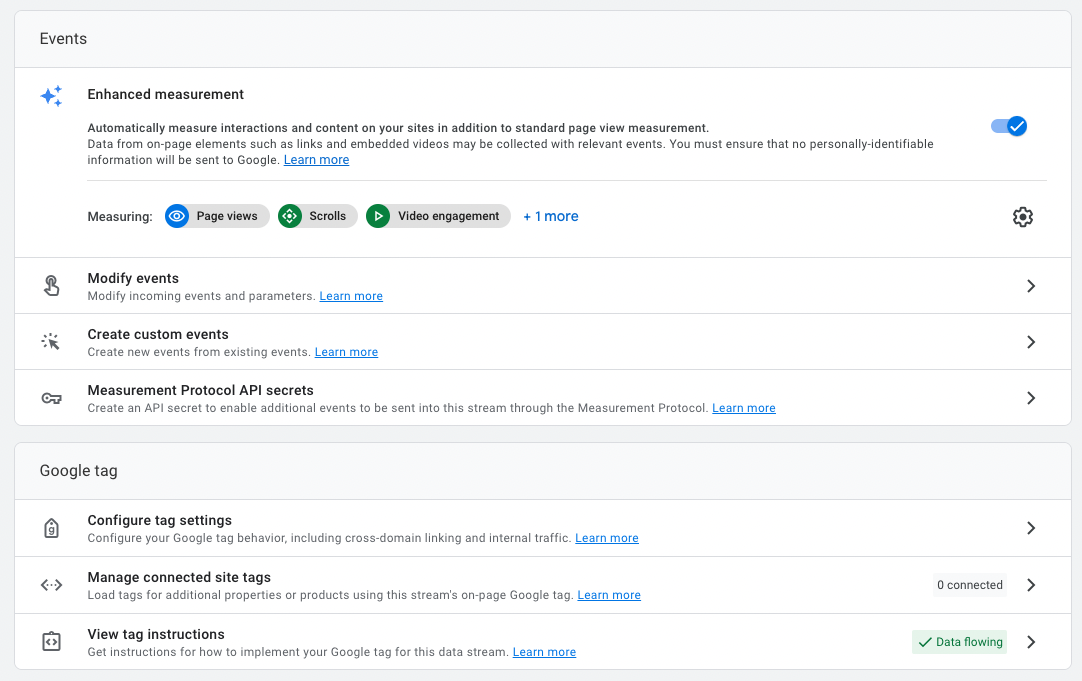
It’s under ‘Configure tag settings’ where you can specify unwanted referrals (e.g. Sagepay), and exclude internal traffic. For the latter, list any number of IPs as having the traffic_type value of ‘internal’, and then from the main property settings screen go to Data Settings > Data Filters and set this existing filter to ‘active’.
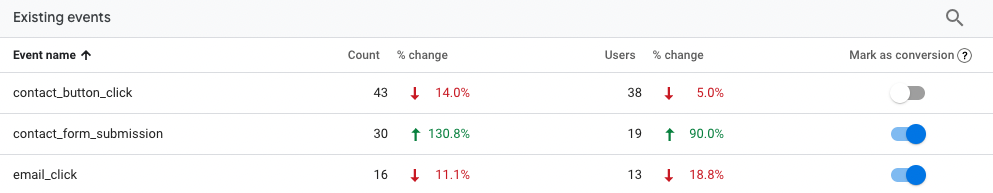
Within property settings you can create new events (although we recommend doing so via Tag Manager), and mark certain events to be recorded as a conversion.
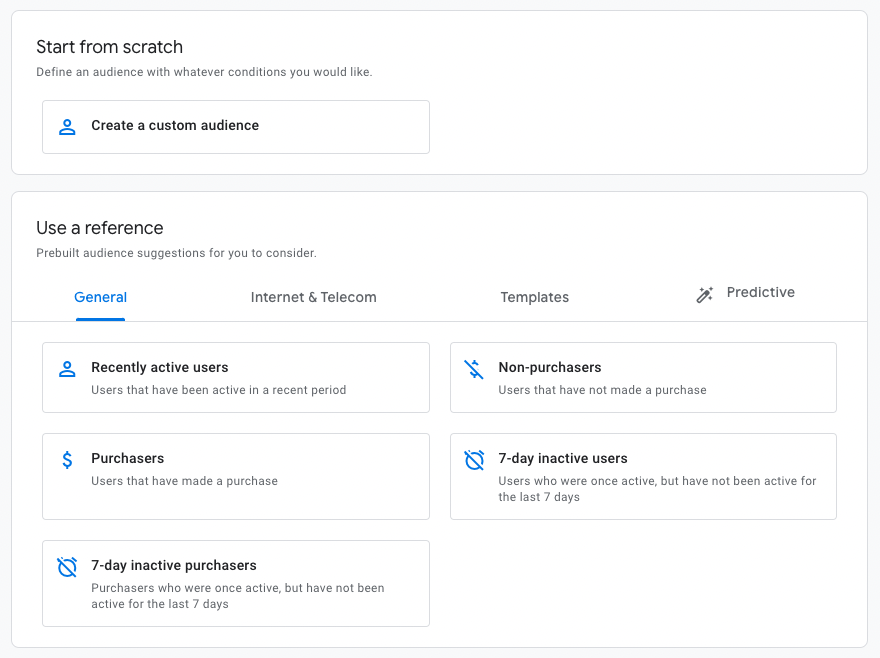
You can also create audiences, where a user will be added to the group based on conditions you specify, such as viewing a certain page or triggering an event. GA4 will automatically add users to a separate audience when they complete a purchase, but you can set up custom ones either from scratch or using a built-in template, which can then be used in Google Ads remarketing lists.
Video Tutorial: and if you're using Tag Manager to debug events, you can combine this with GA4's DebugView tool to monitor event triggers in real-time.
The GA4 reports dashboard
At first glance, the reports dashboard looks a lot more streamlined than UA. Most of the main reports are still here, but it's when you drill down into the data that GA4 pushes you towards its new Explore tab (more on this later).
Reporting overview
The initial Reports snapshot gives you an overview of key info, with a number of tools which are available at the top of most report screens.
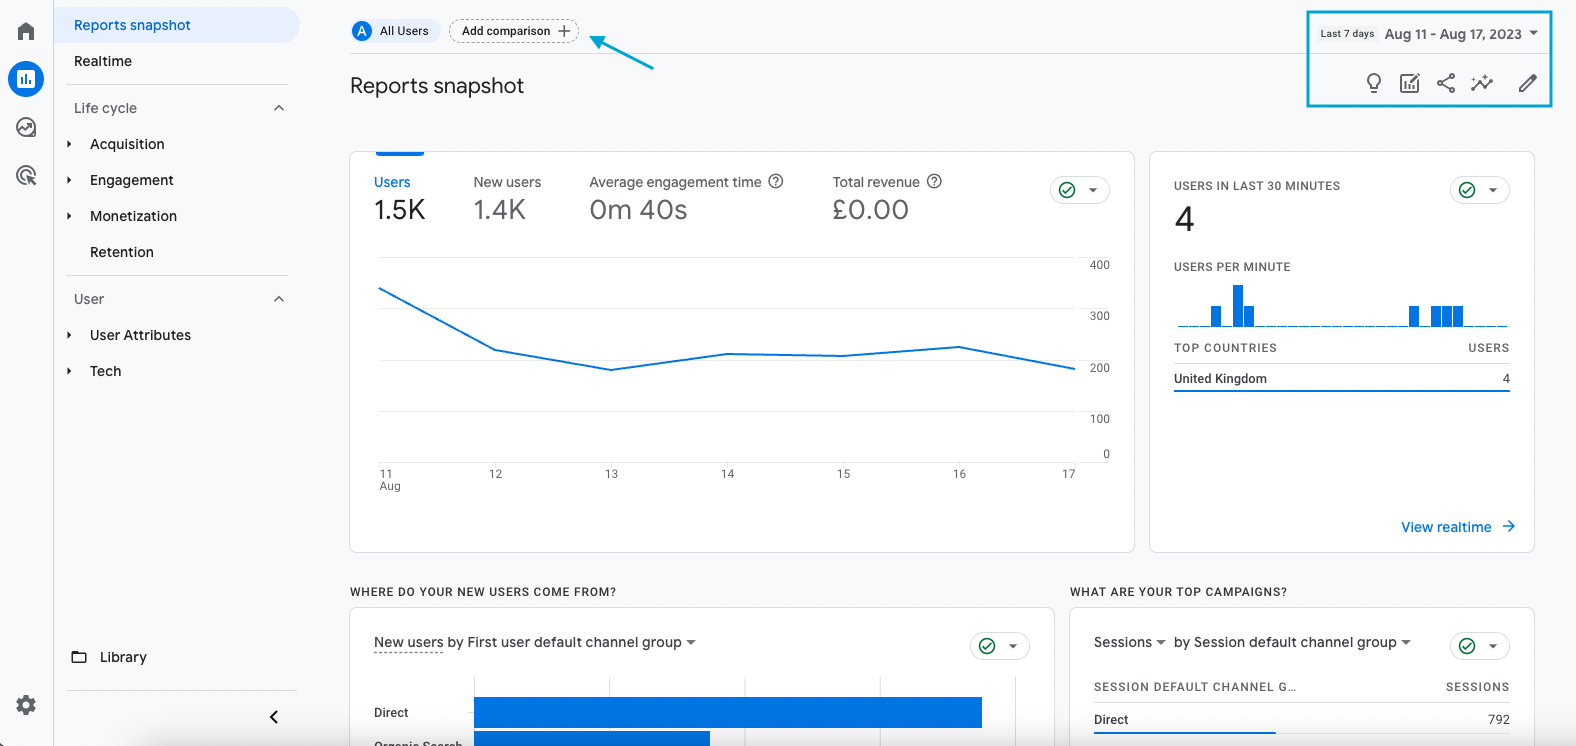
In the top right underneath your date picker you have a few tools. From left to right these are:
Open help panel for some basic tips on customising the reports snapshot screen.
Edit comparisons, which gets its own section in a minute.
Share the report as either a link to the current view (as long as the viewer has access permissions for the property), or generate a PDF/CSV download.
Insights, which is a list of top level data phrased as common questions. You can click on something like “how many users did I have last week”, and GA4 will come back with the relevant info.
Customisation tools to edit the dashboard as you see fit. You can choose a number of cards from GA4’s library, and most come with a few different options (e.g. Cities by All, New, or Returning Users).
By default each report shows data for all users, but at the top you can also add a comparison. This is GA4’s version of segmenting in UA.
Add a comparison
By clicking Add comparison at the top of the screen, you can segment the current report by different conditions to compare against All Users. The most common way you would use this is to analyse different channels, so you might use the following condition to view Organic Search sessions:
Dimension: Session medium
Match Type: exactly matches
Value: organic
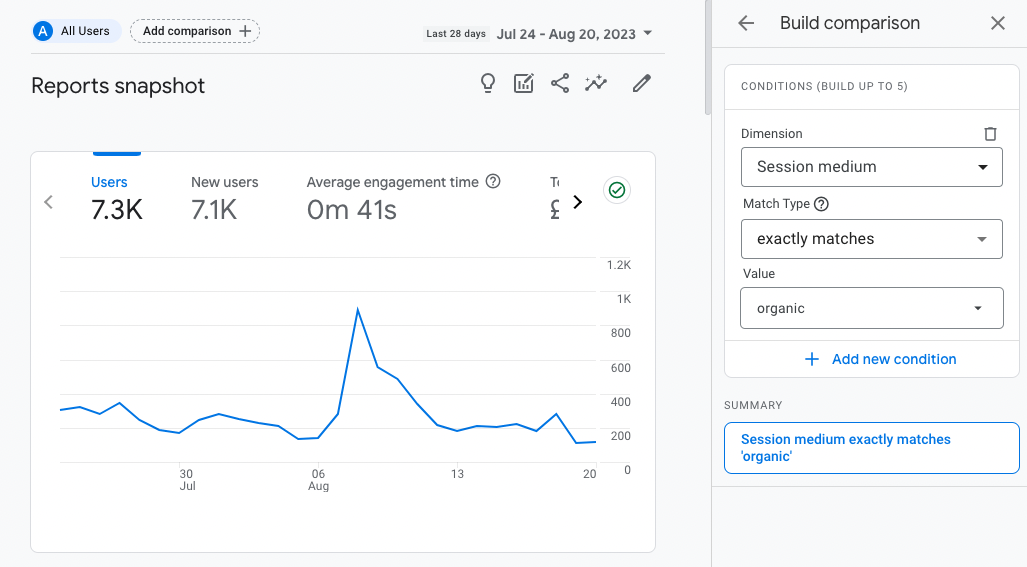
GA4 has a lot of different traffic-source dimensions, and tracks the same user across multiple channels (which will appear as ‘cross-network’). As a dimension like Session medium is only concerned with the current session, it will ignore any cross-network attribution and gives you data closer to what you’re used to seeing in UA’s acquisition report.
The comparison will stay across all report screens, and you can use the Edit comparisons tool mentioned above to change or delete the conditions.
Acquisition reports
The Acquisition section is similar to how it appeared in Universal Analytics, with reports for both User acquisition (where the user was first acquired) and Traffic acquisition (where the user’s current session came from).
GA4 tracks a lot more default channels than UA, such as splitting out social media visits by Organic social and Paid social.
Each table in GA4 has a few different ways to display the data, and the toggle for this is found just above the first column:
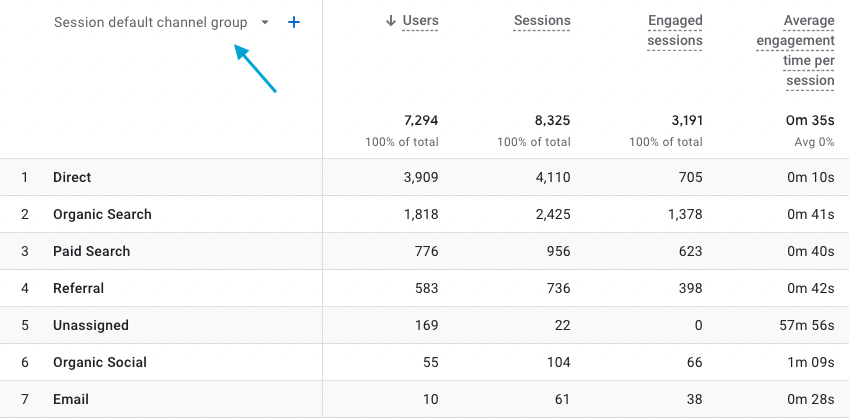
Changing this to session source will show the exact domains people are referred from. Unfortunately this lists sources for all channels together, whereas in UA you could click into Referrals as an example, and then view sources only for that channel. To get that same level of detail in GA4 you’ll need to create an exploration report.
Engagement reports
Engagement is the new Behaviour, and this section reports on all events, both default and custom. Pageviews are events now, and GA4 has two reports for these including a separate one for landing pages.
If you’ve set up a custom content grouping, you can toggle this view in the same place as channel dimensions:

Average engagement time is a new metric in GA4 and for the most part replaces Average session duration in UA (although that is still available). Engagement time checks for a few extra things such as whether your site is in a background tab, and so the time is only recorded while users are actively browsing your site.
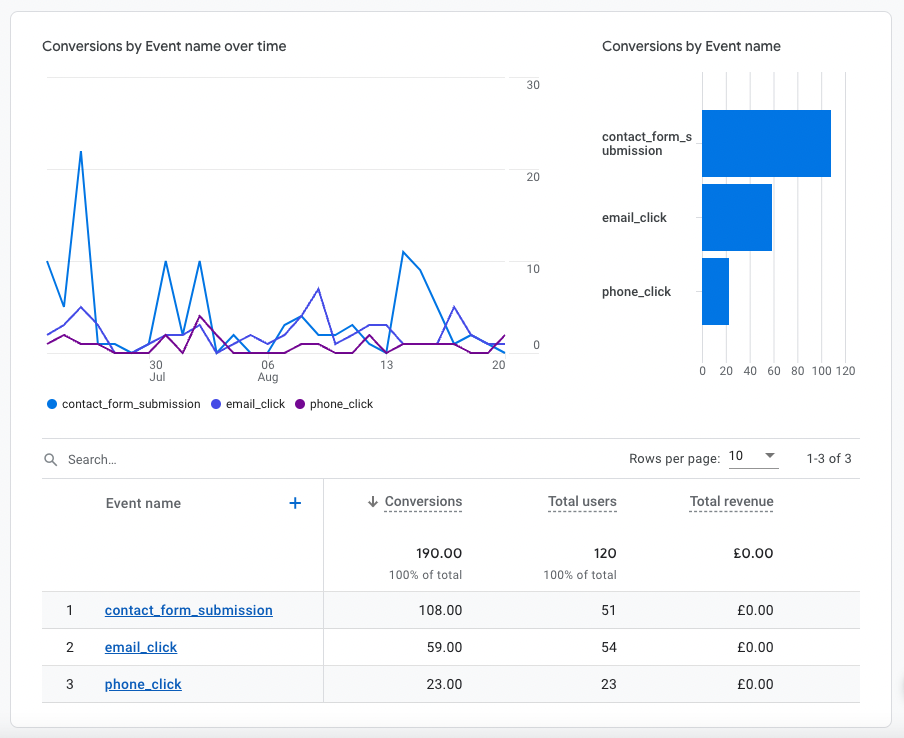
Finally, any events you marked as conversions will be shown in a separate screen, so you can narrow down the actions to only those which measure success for your site and campaign.
Audience reports
The final section in UA was Audience, and in GA4 these reports are scattered around the dashboard a bit.
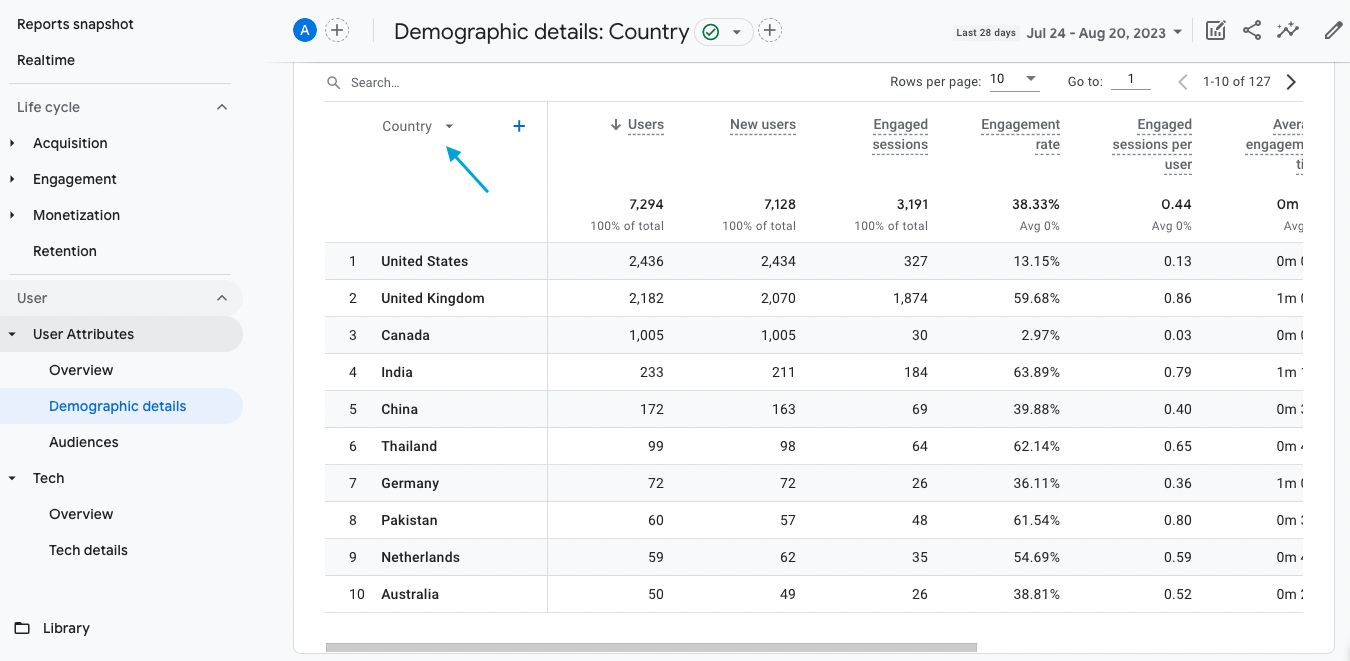
Under User > User Attributes you’ll find demographics data, although you may need to activate Google Signals in order to view more info collected from Google accounts.
Within Demographic details, you can use the same dropdown as before to toggle between Country, City, Interests (if opted in to Google Signals), and more.
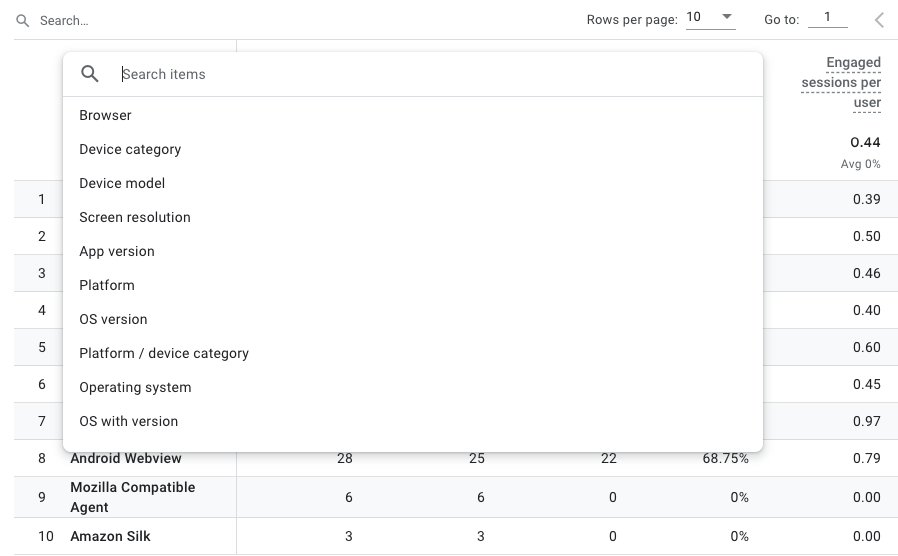
This section is also where you’ll find more data on the custom audiences you’ve set up for remarketing. For breakdowns of usage by device, browser and screen resolution, you need to head to the Tech section. The Tech details report has its own set of display options:
Eagle-eyed readers will have noticed that a couple of reports are absent, like that ugly looking Users Flow report in UA. Time to explore the Explore section of GA4.
GA4 Exploration reports
With GA4 Google has given us the basic reports, but in many cases if you want to drill down into more detail or view more than the last 30 minutes for certain metrics, Google require us to set up our own reports (the cheek of it).
There’s far too much depth to exploration reports to cover in this post, but I can attempt a basic overview.
Let’s go on an exploration
You can set up reports with any kind of data type including paths and funnels. GA4 gives you a few templates to get started:
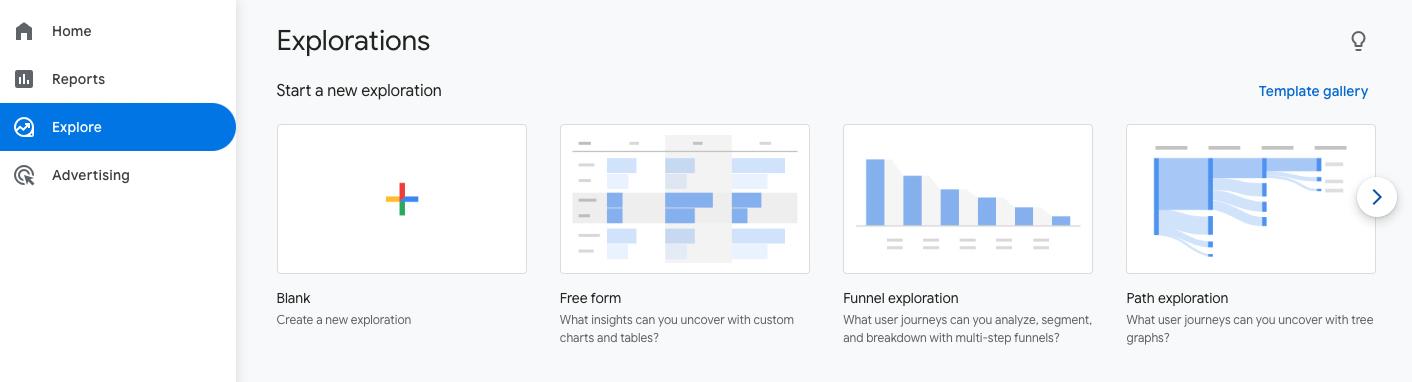
Let’s start with the Free form report template and go through each part.
Exploration variables
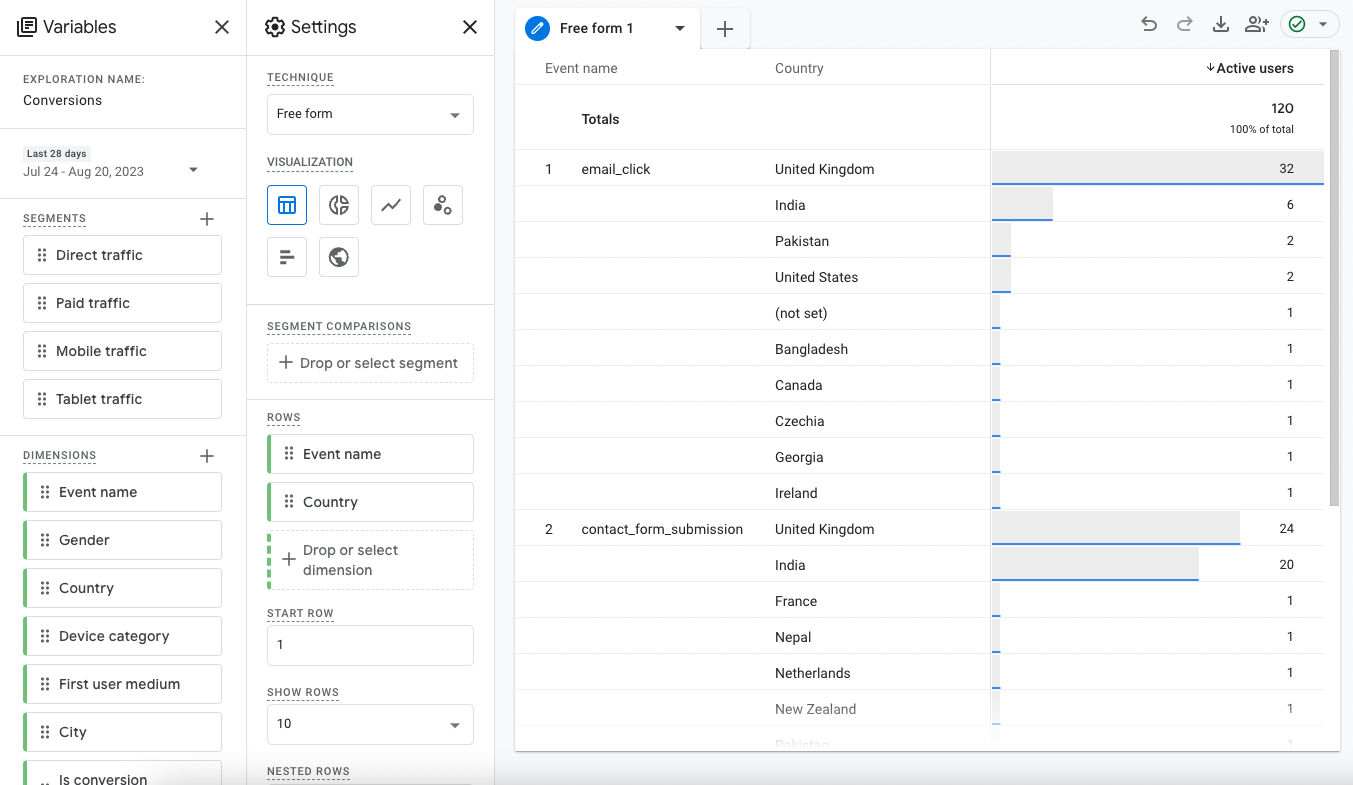
In the far left sidebar you first need to import all of the segments, dimensions and metrics you want to use to build up the report.
Segments are kind of like audiences, where users are included based on certain conditions. The report template includes a few by default for different traffic types.
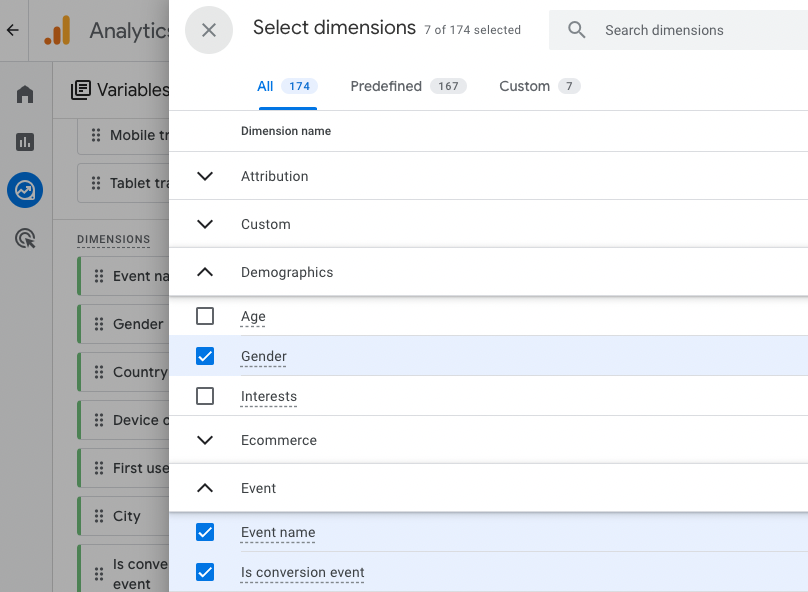
Dimensions are all of the properties you want to view data on, which could be locations, events, or even individual event parameters (if you’ve registered them as a custom definition). Click on the + icon to import whatever you need — you can only add dimensions to the reporting view if you’ve already imported them.
Then do the same for Metrics to see values against each dimension like active users, events and ecommerce actions.
When you have everything imported, you can begin using them in the Settings panel.
Exploration settings
To start with you have a few different report types and ways to display the information — in this example we’re using a simple Free form table report.
We’re going to drop dimensions onto the Rows and/or Columns section to display our report table, and then add metrics to the Values list.
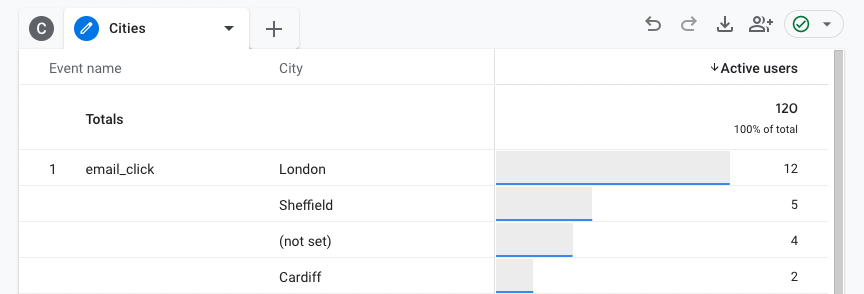
Here we’ve gone with two rows showing both the Events and Cities tracked in the last 28 days. By ticking Nested Rows, the two dimensions are associated with each other so that we can view a list of countries where each event was triggered.
At the top of the reporting area you can create a new tab (or duplicate the current one). Each tab has the same Variables available, but can have different Settings. We could create another tab to drill-down into Events by Cities, another to view by Device, etc.
The final thing to note are Filters. At the bottom of the settings panel you can use any of your dimensions again to include or exclude data.
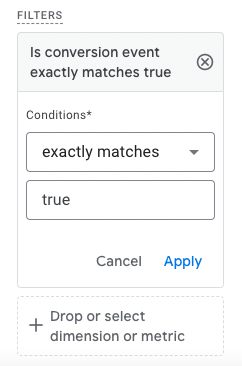
Here we’ve used a dimension to check whether the event is a conversion, and included only those in the report table. We could add multiple filter conditions, such as ‘First user default channel group’ equals ‘Email’ to view only conversions from email marketing, and even combine this with the Campaign dimension to view only a particular newsletter.
Hopefully this gives you an idea of how you can use Exploration reports to get more depth out of GA4 reporting. You can also ‘Share’ these reports from the Explore overview screen so that your clients can view them — though only the owner of a report can change the settings.
Expert GA4 consultancy and training
If you’re feeling a bit overwhelmed with the new interface in GA4, or are unsure about how to view specific data, our team can help.
At Evoluted we’ve completed dozens of GA4 migrations, and provided Google Analytics training sessions at different levels to help clients get to grips with the new analytics platform.
Get in touch today to find out what’s possible with custom reporting.

SEO Executive Dan joined Evoluted in 2022 after making the switch from Web Development to Marketing.
That career path has meant he's provided a fresh perspective to our SEO team and is highly adept at more technical projects like GA4 migrations and analytics tracking.